Geographic Intelligence
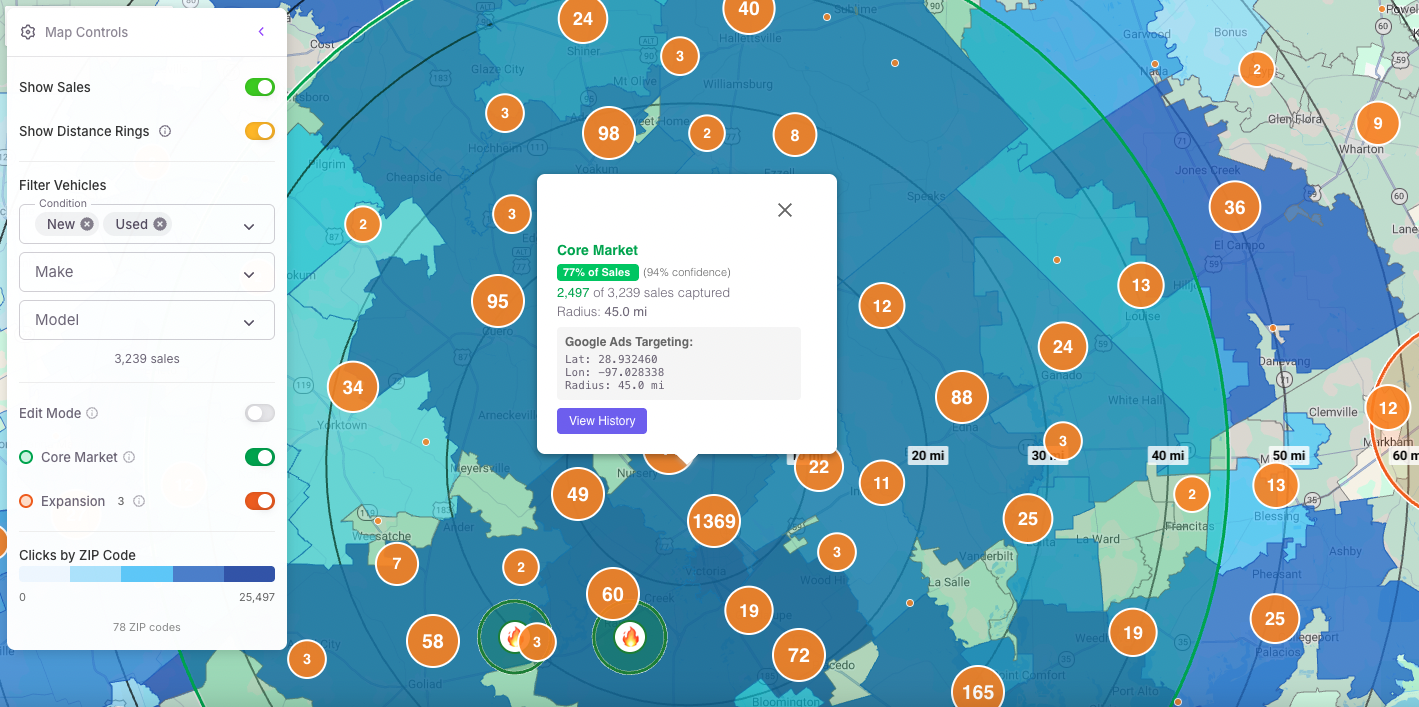
See Where Your Ad Dollars Actually Work
Where are your best customers coming from? Which markets should you expand into? Geo Insights combines Google Ads performance, 12 months of sales history, and demographic data into one map-based dashboard.
- Data-driven Core Market calculation
- Competitor threat intelligence
- AI-powered expansion recommendations
- Model-specific campaign targeting