Geographic Intelligence
See where your ad dollars actually work.
Where are your best customers coming from? Are you spending money in areas that never convert? Which markets should you expand into? Geo Insights answers all of it on a single map.
See Your Market
The Platform
Geo Insights combines your Google Ads performance, 12 months of sales history, demographic data, and competitive intelligence into one view. See where opportunities are hiding and where you're losing to competitors.
The Problem
Most geographic targeting starts with an assumption: pick a radius that feels right, draw a circle, and call it a day.
But that's not how customers actually behave. Urban dealerships surrounded by competitors might only draw efficiently from 25 miles. Rural stores with less competition often pull buyers from 50+ miles out.
The insight: Geo Insights calculates your Core Market from your actual sales data—not assumptions.
1. Establish baseline performance
We calculate your home-turf conversion rate—the percentage of nearby households that become customers, using U.S. Census population data.
2. Analyze population-normalized performance
Expanding distance bands are evaluated against expected sales based on household density. The algorithm detects sustained degradation—not statistical noise.
3. Apply the median distance floor
Your Core Market always captures at least 50% of actual sales, ensuring the boundary reflects real customer behavior.
Market Segmentation
Where you actually win—calculated from your sales data, not assumptions.
Sales clusters that partially overlap your boundary. Opportunities to extend your reach.
Clusters completely outside your core. These deserve dedicated campaigns.
Interactive Performance Map
The heart of Geo Insights is a map that displays performance by ZIP code with color-coded overlays. See where impressions, clicks, cost-per-sale, and sales volume are concentrated.
Blue gradients show ad performance intensity. Green gradients reveal demographic concentrations. Multiple lenses, one map.
Market Reach Analysis
The Market Reach breakdown shows you exactly what's happening in each distance band (0-10 miles, 10-20 miles, and so on):
The cumulative sales curve shows where your sales trail off—your 50th, 75th, and 90th percentile distances. If you're spending heavily in areas beyond your natural draw, you'll see it immediately.
Competitor Threat Intelligence
Knowing where you're winning is half the battle. You also need to know where you're losing—and to whom.
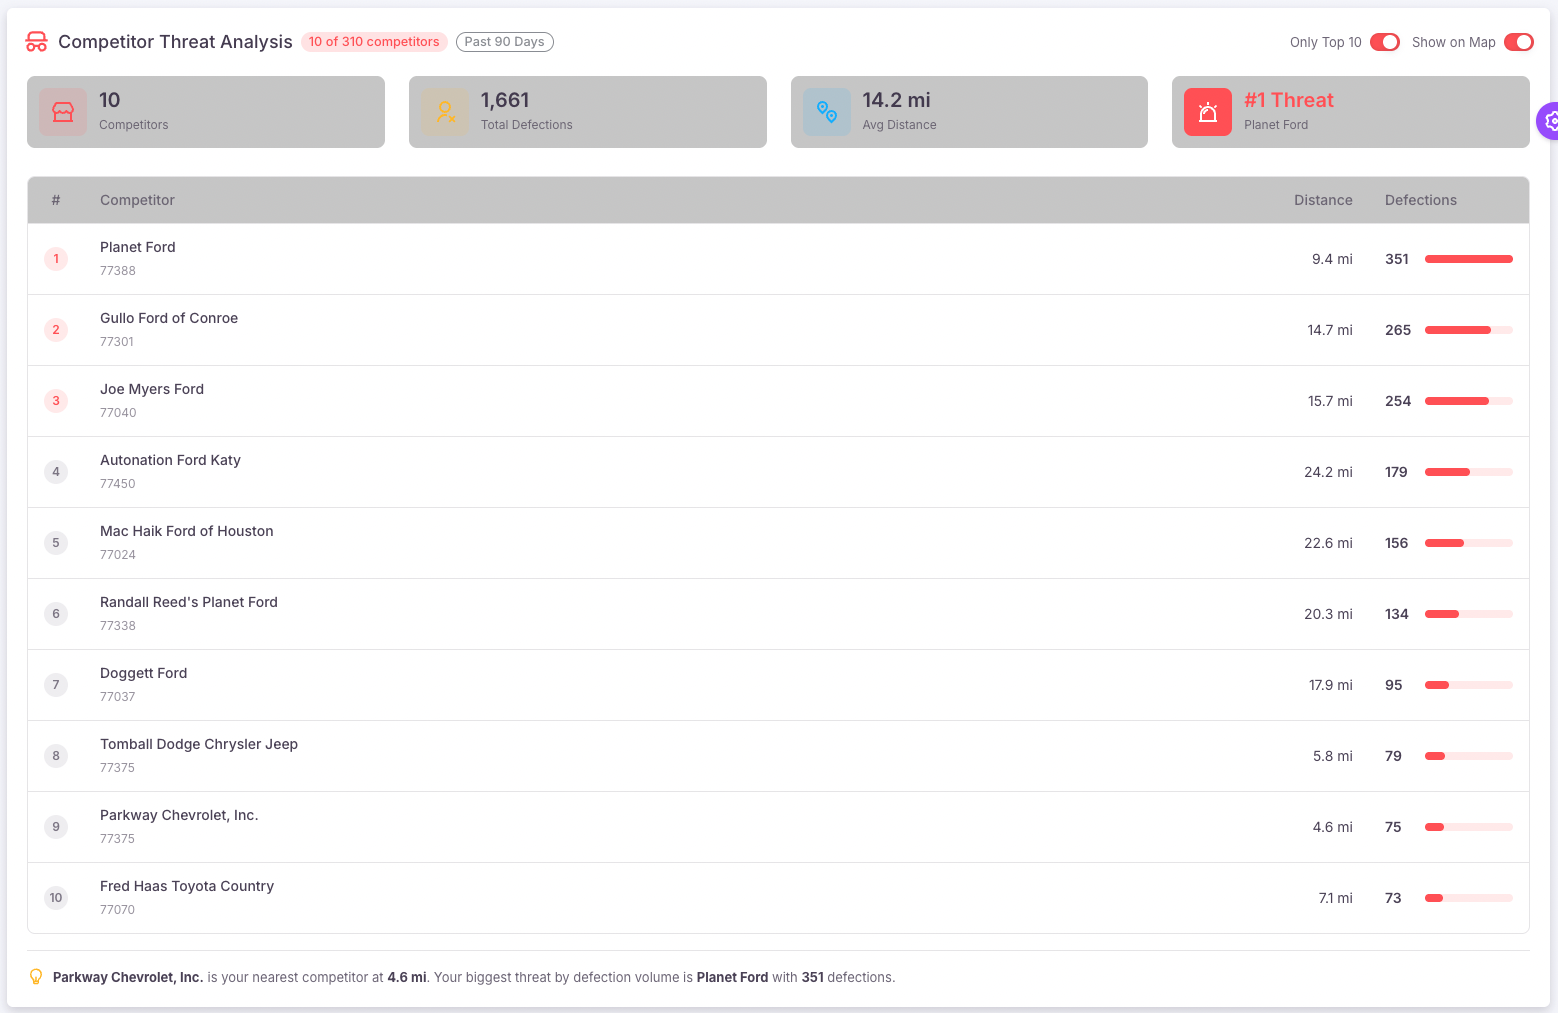
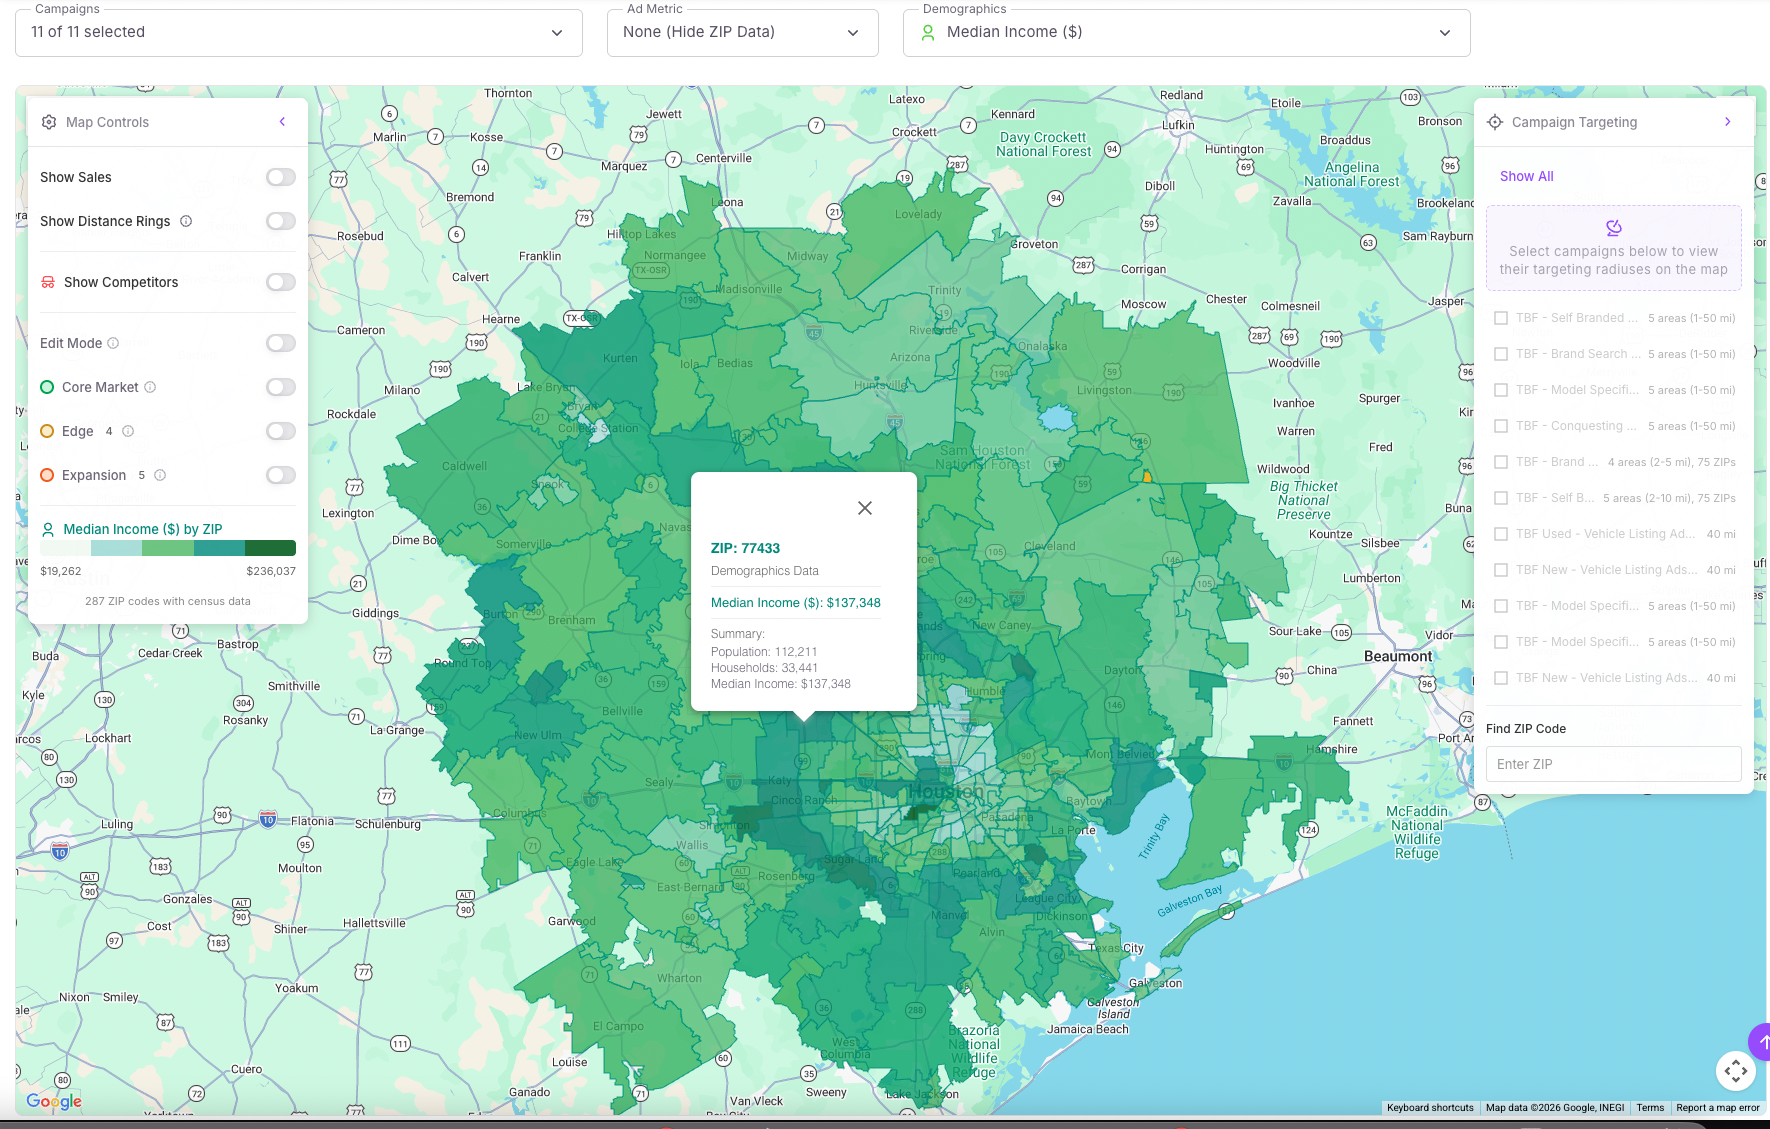
The Competitor Threat Analysis shows:
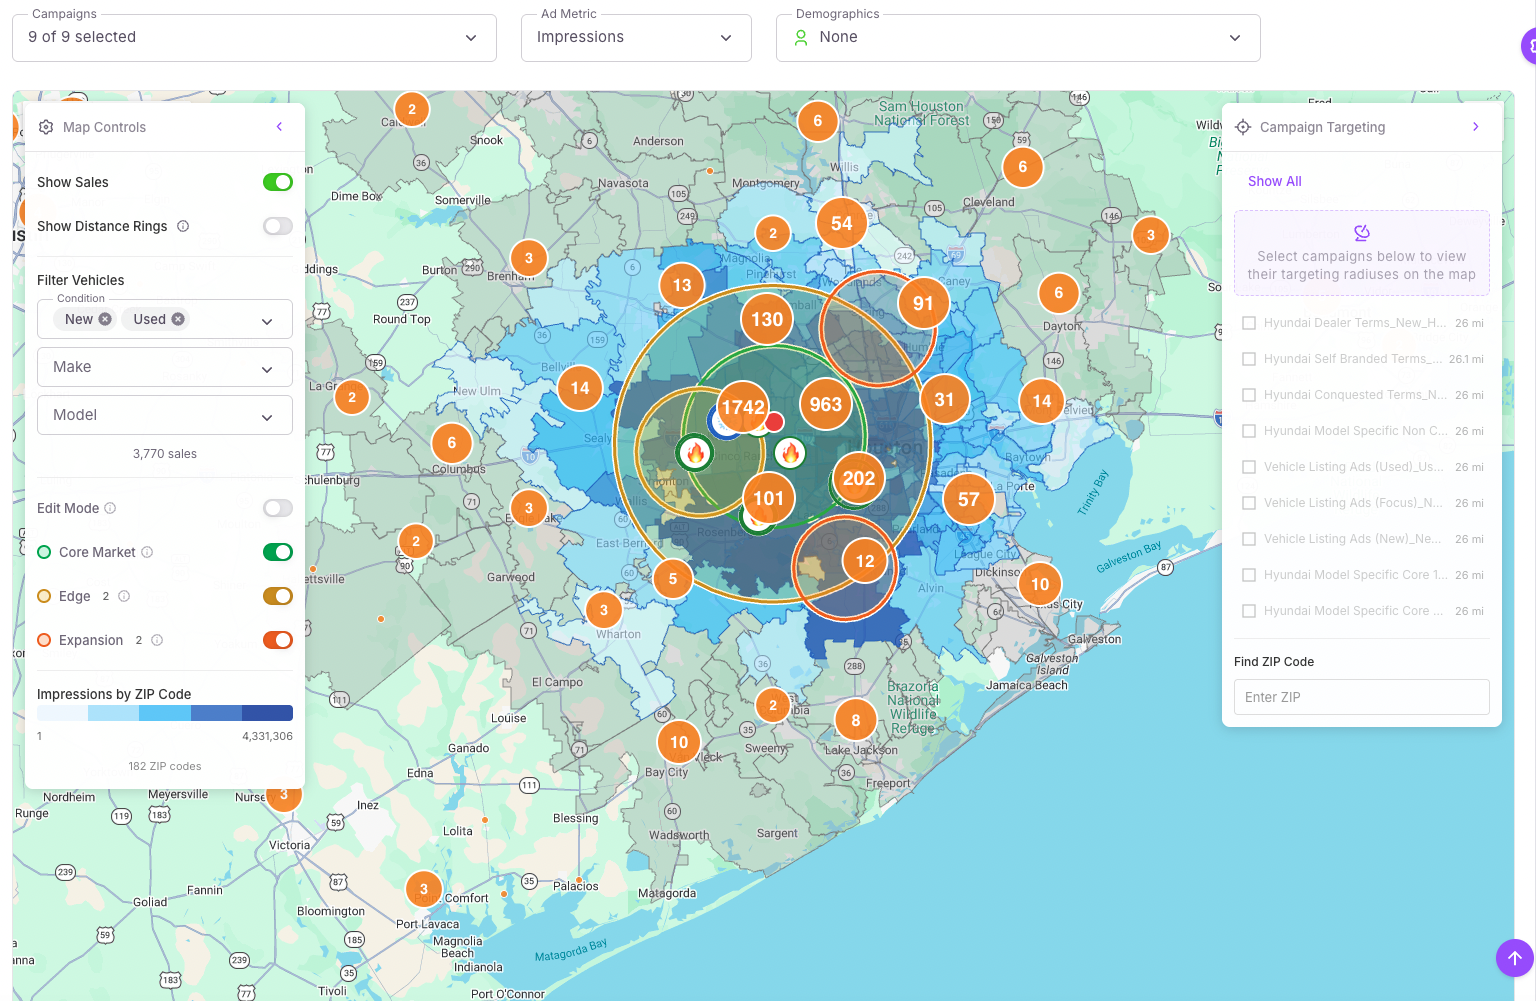
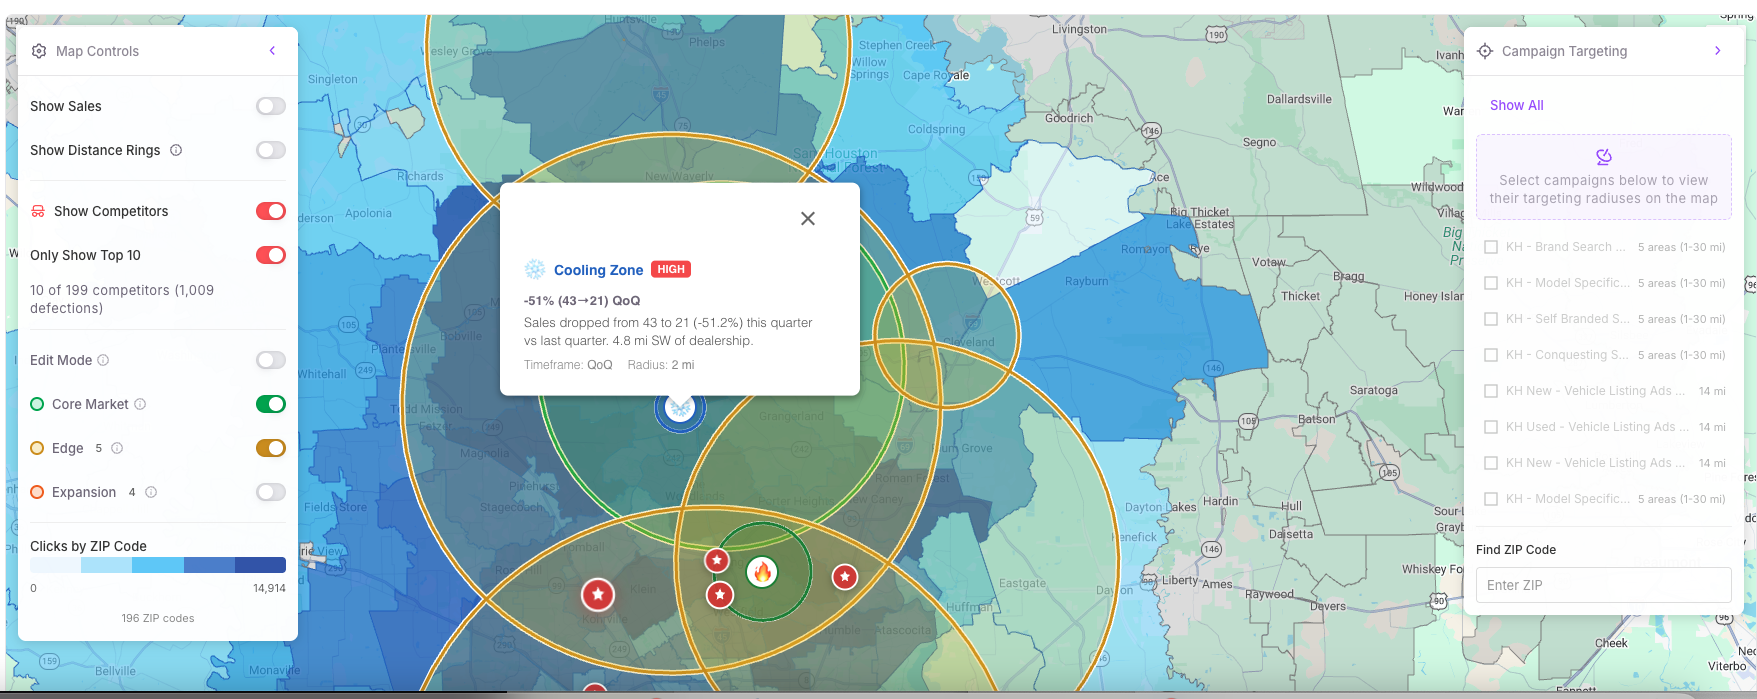
Red markers show exactly where competitors are pulling your customers. Click any competitor to see their defection count and location.
*Competitor Threat Intelligence requires a subscription to Urban Science.
AI-Powered Geo Recommendations
The Recommended Store Geos feature uses ensemble machine learning—combining multiple clustering algorithms—to identify the most promising geographic opportunities.
Looking to expand your truck market? Filter by trucks. Growing CPO sales? Filter by used inventory. The recommendations adapt to your goals.
Example: Filter to F-150 purchases, hit "Find Targets", and get geographic clusters where that model has sold well—with centroids ready for Google Ads proximity targeting.
Model-Specific Campaign Targeting
Say you're launching an F-150 promotion. Filter your sales to show only F-150 purchases, then hit Find Targets. The system analyzes 12 months of data and identifies geographic clusters where that model has sold well.
You get:
The centroids are designed for easy loading into Google Ads proximity targeting.
Demographic Intelligence
The Demographics Overlay provides census-level data to help you understand your market:
See how these factors correlate with your sales patterns.
AI Market Narratives
Geo Insights automatically analyzes your sales trends and generates plain-language narratives that highlight what's changing in your market.
Areas where sales are increasing. These are growth opportunities—double down on what's working.
Areas where sales are declining—often a sign that competitors are conquesting your customers.
Click any highlighted area to navigate directly on the map and see the underlying data.
More Features
Track Cost/Sale across 30, 60, and 90-day windows. Downward trend (green) = more efficient. Upward trend (red) = costs rising. One metric that tells you if your strategy is working.
Edit Mode lets you drag market centers, adjust radii, create new markets anywhere, and track all changes with full audit history.
Available in BETA
Geo Insights analyzes 12 months of sales data combined with real-time Google Ads performance.